Important Concepts
The parameters selected during de-replication and genome comparison are critical to understanding what dRep is actually doing to your genome set. This section of the docs will address the following key concepts:
1. Choosing an appropriate secondary ANI threshold. This threshold dictates how similar genomes need to be for them to be considered the “same”. This section goes into how to choose an appropriate S_ANI threshold.
2. Minimum alignment coverage. When calculating the ANI between genomes we also determine what fraction of the genomes were compared. The value can be used to establish minimum needed level of overlap between genomes (cov_thresh), but there is a lot to be aware of when using this parameter.
3. Choosing representative genomes. During de-replication the first step is identifying groups of similar genomes, and the second step is picking a Representative Genome (RG) for each cluster. This section gets into the second step.
4. Using greedy algorithms. Greedy algorithms are those that take “shortcuts” to arrive at a solution. dRep can use greedy algorithms at several stages to speed up runtime; this section gets into how to use them and what to be aware of.
5. Importance of genome completeness. Due to it’s reliance on Mash genomes must be somewhat complete for dRep to handle them properly. This section explains why.
6. Oddities of hierarchical clustering. After all genomes are compared, dRep uses hierarchical clustering to convert pair-wise ANI values into clusters of genomes. This section gets into how this works and where it can go wrong.
7. Overview of genome comparison algorithms. dRep has lots of different genome comparison algorithms to choose from. This section briefly describes how they work and the differences between them.
8. Comparing and dereplicating non-bacterial genomes. Some thoughts about the appropriate parameters to use when comparing things like bacteriophages, plasmids, and eukaryotes.
See also
- User manual
- For more general descriptions of routine parameters
- Overview
- For a general overview of dRep concepts
1. Choosing an appropriate secondary ANI threshold
There is no one definition of the average nucleotide identity (ANI) shared between two genomes that are the “same”. This is a decision that the user must make on their own depending on their own specific application. The ANI is determined by the secondary clustering algorithm, the minimum secondary ANI is the minimum ANI between genomes to be considered the “same”, and the minimum aligned fraction is the minimum amount of genome overlap to believe the reported ANI value. See 7. Overview of genome comparison algorithms for descriptions of secondary clustering algorithms and 2. Minimum alignment coverage for concepts about adjusting the minimum aligned fraction.
One use-case for dereplication is to take a large group of genomes and pick out set of Species-level Representative Genomes (SRGs). This was recently done using dRep in Almeida et. al. , where the goal was to generate a comprehensive set high-quality reference genomes for microbes that live in the human gut. These is debate about the exact threshold for delineating bacteria of different species, but most studies agree that 95% ANI is an appropriate threshold for species-level de-replication. See Olm et. al. 2020 for context on how this threshold was chosen and some debate on whether bacterial species exist as a continuum or as discrete units in nature.
Another use-case for dereplicaiton is to generate a set of genomes that are distinct enough to avoid mis-mapping. If one were to map metagenomic reads (which are usually ~150bp) to two genomes that were 99.9% the same, most reads would map equally well to both genomes, and you wouldn’t be able to tell which read truly “belongs” to one genome or the other. If the goal of dereplication is to generate a set of genomes that are distinct when mapping short reads, 98% ANI is an appropriate threshold. See the following page for how the 98% value was arrived at.
The default value in dRep is 99%, and this is a limit to how precise the secondary ANI threshold can be. As a rule of thumb thresholds as high as 99.9% are probably safe, but higher than that is beyond the limit of detection. Comparing genomes to themselves will usually yield ANI values of ~99.99%, since the algorithms aren’t perfect and get thrown off by genomic repeat regions and things like this. See the publication for the program InStrain for details about testing the limits of detection for dRep, and how to perform more detailed stain-level comparisons if desired.
For additional thoughts on this threshold, see the blog post: Are these microbes the “same”?.
Note
Keep in mind that in all cases you are collapsing closely related, but probably not identical, strains / genomes. This is simply the nature of the beast. If desired, you can compare the strains by mapping the original reads back to the de-replicated genome to visualize the strain cloud (Bendall 2016, blog post) using the program inStrain
2. Minimum alignment coverage
The minimum aligned fraction is the minimum amount that genomes must overlap to make the reported ANI value “count”. This value is reported as part of the ANIm/gANI algorithms.
Imagine a scenario where two distantly related genomes share a single identical transposon. When the genome comparison algorithm is run, the transposon is probably the only part of the genomes that aligns, and the alignment will have 100% ANI. This will result in a reported ANI of 100%, and reported aligned fraction of ~0.1%. The minimum aligned fraction is to handle the above scenario- anything with less than the minimum aligned fraction of genome alignment will have the ANI changed to 0. Default value is 10%.
The way that dRep handles minimum aligned fraction can account for the above scenario, but it’s pretty clumsy overall. When a comparison is below the minimum aligned fraction dRep literally just changes the ANI from whatever the algorithm reported to a “0”. This can cause problems with hierarchical clustering down the line (see 7. Overview of genome comparison algorithms). I’ve tried to think about better ways of handling it, but it’s just a difficult thing to account for. How do you handle a set of genomes that share 100% ANI over 20% of their genomes? After years of using dRep, however, I’ve come to this conclusion that this is rarely a problem in practical reality. In most cases the aligned fraction is either really high (>50%) or really low (>10%), so the default value of 10% works in most cases. See Figure 1 in Olm et. al. 2020 for a depiction of typical intra-species (genomes share >95% ANI) alignment coverage values, and notice that genomes with >95% ANI almost never have low alignment coverage.
Note
It has been suggested that a minimum aligned fraction of 60% should be applied to species-level taxonomic definitions (Varghese 2015). However, this is probably too stringent when incomplete genomes are being used (as is often the case with genome de-replication).
3. Choosing representative genomes
dRep uses a score-based system to pick representative genomes. Each genome in the cluster is assigned a score, and the genome with the highest score is chosen as the representative. This score is based on the formula:
Where A-F are command-line arguments with default values of 1, 5, 1, 0.5, 0, and 1, respectively. Adjusting A-F lets you decide how much to weight particular features when choosing representative genomes. For example, if you really care about having low contamination and high N50, you could increase B and D.
Completeness, Contamination, and strain heterogeneity are provided by the user or calculated with checkM. N50 is a measure of how big the pieces are that make up the genome. size is the total length of the genome. Centrality is a measure of how similar a genome is to all other genomes in it’s cluster. This metric helps pick genome that are similar to all other genomes, and avoid picking genomes that are relative outliers.
Some publications have added other metrics to their scoring when picking representative genomes, such as whether or not the genome came from an isolate. See A unified catalog of 204,938 reference genomes from the human gut microbiome and A complete domain-to-species taxonomy for Bacteria and Archaea for examples.
4. Using greedy algorithms
In layman’s terms, greedy algorithms are those that take shortcuts to run faster and arrive at solutions that may not be optimal but are “close enough”. The better the greedy algorithm, the smaller the difference between the optimal solution and the greedy solution. Since pair-wise comparisons quickly scale to a level that would take decades to compute, dRep uses a number of greedy algorithms to speed things up.
One greedy algorithm dRep uses is primary clustering. Performing this step dramatically reduces the number of genome comparisons have to be made, decreasing run-time. The cost of this is that if genomes end up in different primary clusters they will never be compared, and thus will never be in the same final clusters. That’s why the section below (Importance of genome completeness) is important.
Note
In 2021 (dRep v3) several additional greedy algorithms were introduced, described below. These are relatively new features, so please don’t hesitate to reach out if you notice problems or have suggestions.
–multiround_primary_clustering performs primary clustering in a series of groups that are than merged at the end with single linkage clustering. This dramatically decreases RAM usage and increases speed, and the cost of a minor loss in precision and the inability to plot primary_clustering_dendrograms. Especially helpful when clustering 5000+ genomes.
–greedy_secondary_clustering use a heuristic to avoid pair-wise comparisons when doing secondary clustering. The way this works is that one genome is randomly chosen to represent a cluster. Then the next genome is compared to that one. If it’s below ANI thresholds with that genome, it will be put in that cluster. If it’s not, it will be put into a new cluster and made the representative genome of the new cluster. The 3rd genome will then be comparing to all cluster representatives, and so on. This essentially results in single linkage clustering without the need for pair-wise comparisons. Unfortunately this doesn’t increase speed as much as you would expect due to the need of FastANI to continually re-sketch genomes. This option only works for the fastANI S_algorithm at the moment.
–run_tertiary_clustering is not a greedy algorithm, but is a way to handle potential inconsistencies introduced by greedy algorithms. Once clustering is complete and representative genomes are chosen, this option run an additional round of clustering on the final genome set. This is especially useful when greedy clustering is performed and/or to handle cases where similar genomes end up in different primary clusters. It’s essentially a check to make sure that all genomes are as distinct from one another as they should be based on the parameters given.
5. Importance of genome completeness
This decision is much more complicated than the previous. Essentially, there exists a trade-off between computational efficiency and the minimum genome completeness.
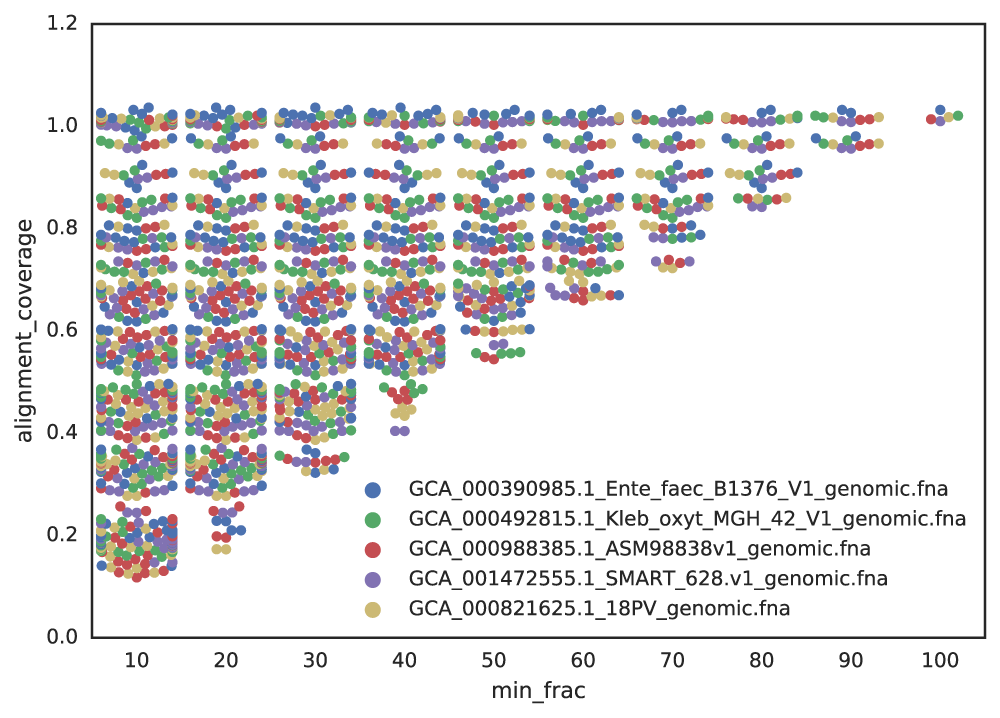
Figure A: Five genomes are subset to fractions ranging from 10% - 100%, and fractions from the same genome are compared. The x-axis is the minimum genome completeness allowed. The looser this value is, the wider the range of aligned fractions.
As shown in the above Figure A, the lower the limit of genome completeness, the lower possible aligned fraction of two genomes. This makes sense- if you randomly take 20% of a genome, and than do the same thing again, when you compare these two random 20% subsets you would not expect very much of them to align. This “aligned fraction” really becomes a problem when you consider it’s effect on Mash:
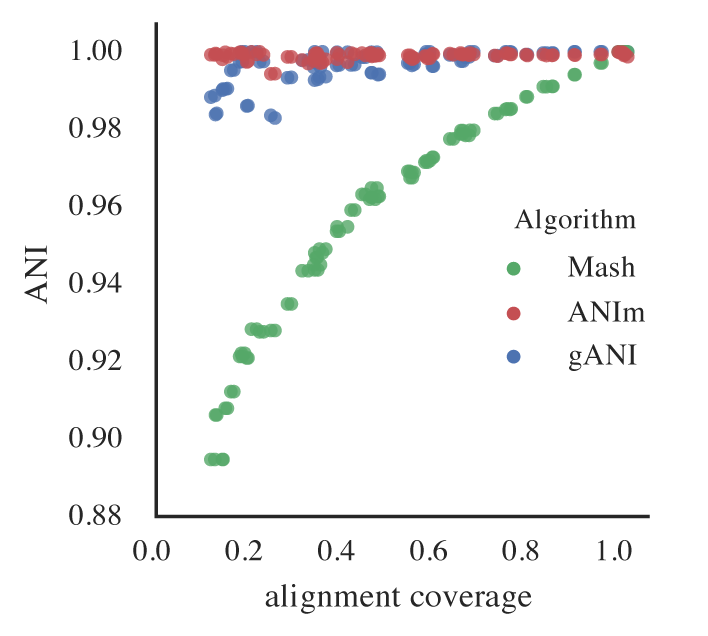
Figure B: An identical E. coli genome is subset to fractions ranging from 10% - 100% and fractions are compared. When lower amounts of the genome align (due to incompleteness), Mash ANI is severely impacted
As shown in the above Figure B, the lower the aligned fraction, the lower the reported Mash ANI for identical genomes.
Remember- genomes are first divided into primary clusters using Mash, and then each primary cluster is divided into secondary clusters of the “same” genomes. Therefore, genomes which fit the definition of “same” must end up in the same primary cluster, or the program will never realize they’re the same. As more incomplete genomes have lower Mash values (even if the genomes are truly identical; see Figure B), the more incomplete of genomes you allow into your genome list, the more you must decrease the primary cluster threshold.
Note
Having a lower primary cluster threshold which will result in larger primary clusters, which will result in more required secondary comparisons. This will result in a longer run-time.
Still with me?
For example, say I set the minimum genome completeness to 50%. If I take an E. coli genome, subset it 50% 2 times, and compare those 2 subset genomes together, Mash will report an ANI of 96%. Therefore, the primary cluster threshold must be at least 96%, otherwise the two genomes could end up in different primary clusters, and thus would never have have the secondary algorithm run between them, and thus would not be de-replicated.
You don’t want to set the primary cluster threshold super low, however, as this would result in more genomes being included in each primary cluster, and thus more secondary comparisons (which are slow), and thus a higher run-time.
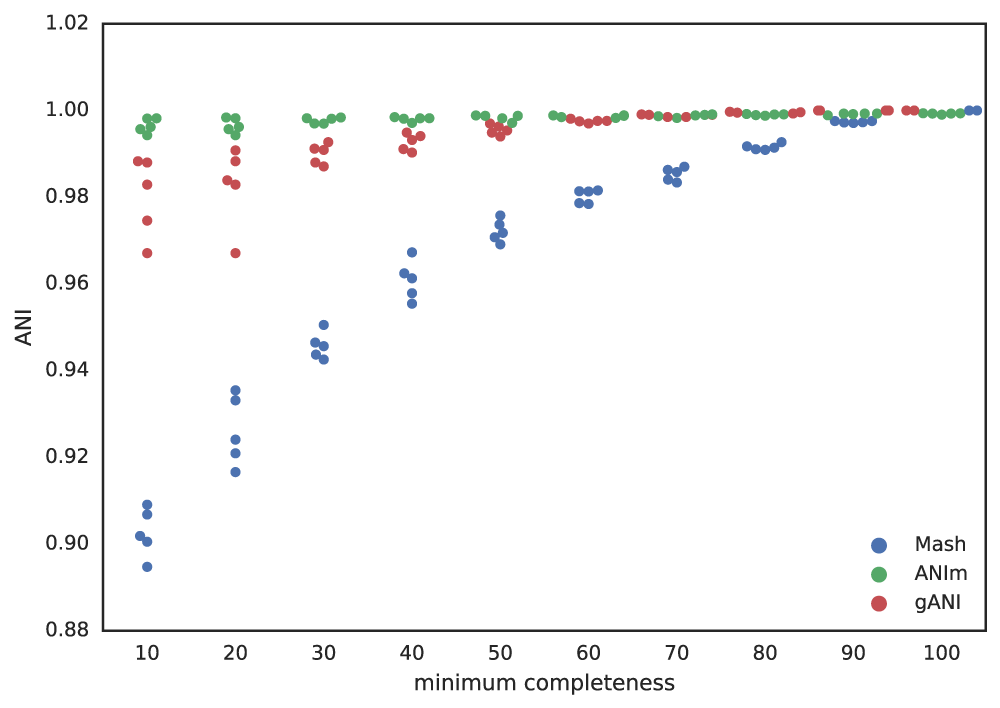
Putting this altogether gives us a figure with the lowest reported ANI of identical genomes being subset to different fractions. This figure only takes into account 5 different genomes, but gives a rough idea of the limits.
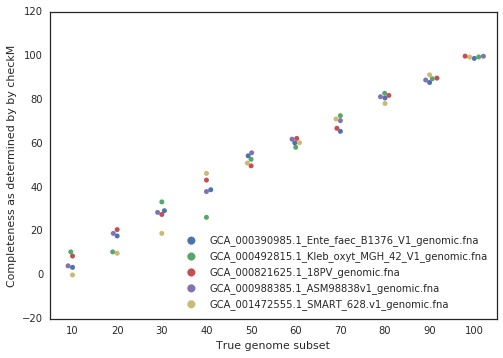
A final piece to consider is that when running dRep for real, the user doesn’t actually know how incomplete their genomes are. They have to rely on metrics like single copy gene inventories to tell them. This is the reason phage and plasmids are not currently supported by dRep- there is no way of knowing how complete they are, and thus no way of filtering out the bins that are too incomplete. In general though, checkM is pretty good at accessing genome completeness:
Note
Some general guidelines for picking genome completeness thresholds:
- Going below 50% completeness is not recommended. The resulting genomes will be very crappy anyways, and even the secondary algorithms break-down at this point.
- Lowering the secondary ANI should result in a consummate lowering in MASH ANI. This is because you want Mash to group non-similar and incomplete genomes.
6. Oddities of hierarchical clustering
The most common “bug” reported to dRep is that genome pairs with an ANI greater than the threshold end up in different clusters, or genome pairs with ANI less than the threshold end up in the same cluster. This almost always happens because of hierarchical clustering, the way that dRep transforms pair-wise ANI values into clusters.
By default, hierarchical clustering is performed in dRep using average linkage (https://docs.scipy.org/doc/scipy/reference/generated/scipy.cluster.hierarchy.linkage.html) which can result in scenarios like those described above. If you want all cases where two genomes are over your thresholds to be in the same cluster, you can run it in single mode (–clusterAlg single). The problem is that this can create big clusters- for example if A is similar to B, and B is similar to C, but A and C are not similar, what do you do? In single mode A, B, and C will be in the same cluster, and in average mode some averaging is done to try and handle this.
dRep can use any method of linkage listed at the following webpage by using the –clusterAlg argument: https://docs.scipy.org/doc/scipy/reference/generated/scipy.cluster.hierarchy.linkage.html .
Note
dRep also generates dendrogram figures to visualize the hierarchical clustering (though if you have too many genomes this can get too big to be visualized). This blog post was instrumental in my understanding of how hierarchical clustering works and how to implement it in python.
7. Overview of genome comparison algorithms
Primary clustering is always performed with Mash; an extremely fast but somewhat inaccurate algorithm.
There are several supported secondary clustering algorithms. These calculate the accurate Average Nucleotide Identity (ANI) between genomes that is used to cluster genomes into secondary clusters. The following algorithms are currently supported as of version 3:
- ANIn (Richter 2009). This aligns whole genomes with nucmer and compares the aligned regions.
- ANImf (DEFAULT). This is the same as ANIn, but filters the alignments such that each region of genome 1 and only align to a single region of genome 2. This takes slightly more time, but is much more accurate on genomes with repeat regions
- gANI (Varghese 2015). This aligns genes (ORFs) called by Prodigal instead of aligning whole genomes. This algorithm is a bit faster than ANIm-based algorithms, but only aligns coding regions.
- goANI. This is my own open-source implementation of gANI, which is not open source (and for which the authors would not share the source code when asked). I wrote this algorithm so that I could calculate dN/dS between aligned genes for this study (you can too using dnds_from_drep.py). Requires the program NSimScan.
- FastANI (Jain 2018). A really fast Mash-based algorithm that can also handle incomplete genomes. Seems to be just as accurate as alignment-based algorithms. Should probably be the default algorithm when you care about runtime.*
Note
None of these algorithms are perfect, especially in repeat-prone genomes. Regions of the genome which are not homologous can align to each other and artificially decrease ANI. In fact, when a genome is compared to itself, the algorithms often reports values <100% for this reason.
8. Comparing and dereplicating non-bacterial genomes
dRep was developed for the use-case of bacterial dereplication, and there are some things to be aware of when running it on non-bacterial entities.
A major thing to be aware of is primary clustering. As described in 5. Importance of genome completeness, genomes need to be >50% complete for primary clustering to work. If you’re comparing entities in which you cannot assess completeness or in which you want to compare genomes that share only a limited number of genes (e.g. phage or plasmids), this a problem. The easiest way to handle it is to avoid primary cluster altogether with the parameter –SkipMash, or lower the primary clustering threshold with -pa.
Also consider the effect of alignment coverage (2. Minimum alignment coverage) on hierarchical clustering (6. Oddities of hierarchical clustering). If your working with entities that are especially mosaic, like phage, this can be a bigger problem than with bacteria.
Genome filtering and scoring is also a major factor. If your genomes can’t be assessed by checkM, you can turn off quality filtering and the use of completeness and contamination when picking genomes with the flag –ignoreGenomeQuality.
When considering these options for my own studies (Olm 2019 and Olm 2020), I landed on the following dRep command for clustering bacteriophages and plasmids. Please take this for what it is, one person’s attempt to handle these parameters for their specific use-case, and don’t be afraid to make additional adjustments as you see fit:
dRep dereplicate --S_algorithm ANImf -nc .5 -l 10000 -N50W 0 -sizeW 1 --ignoreGenomeQuality --clusterAlg single